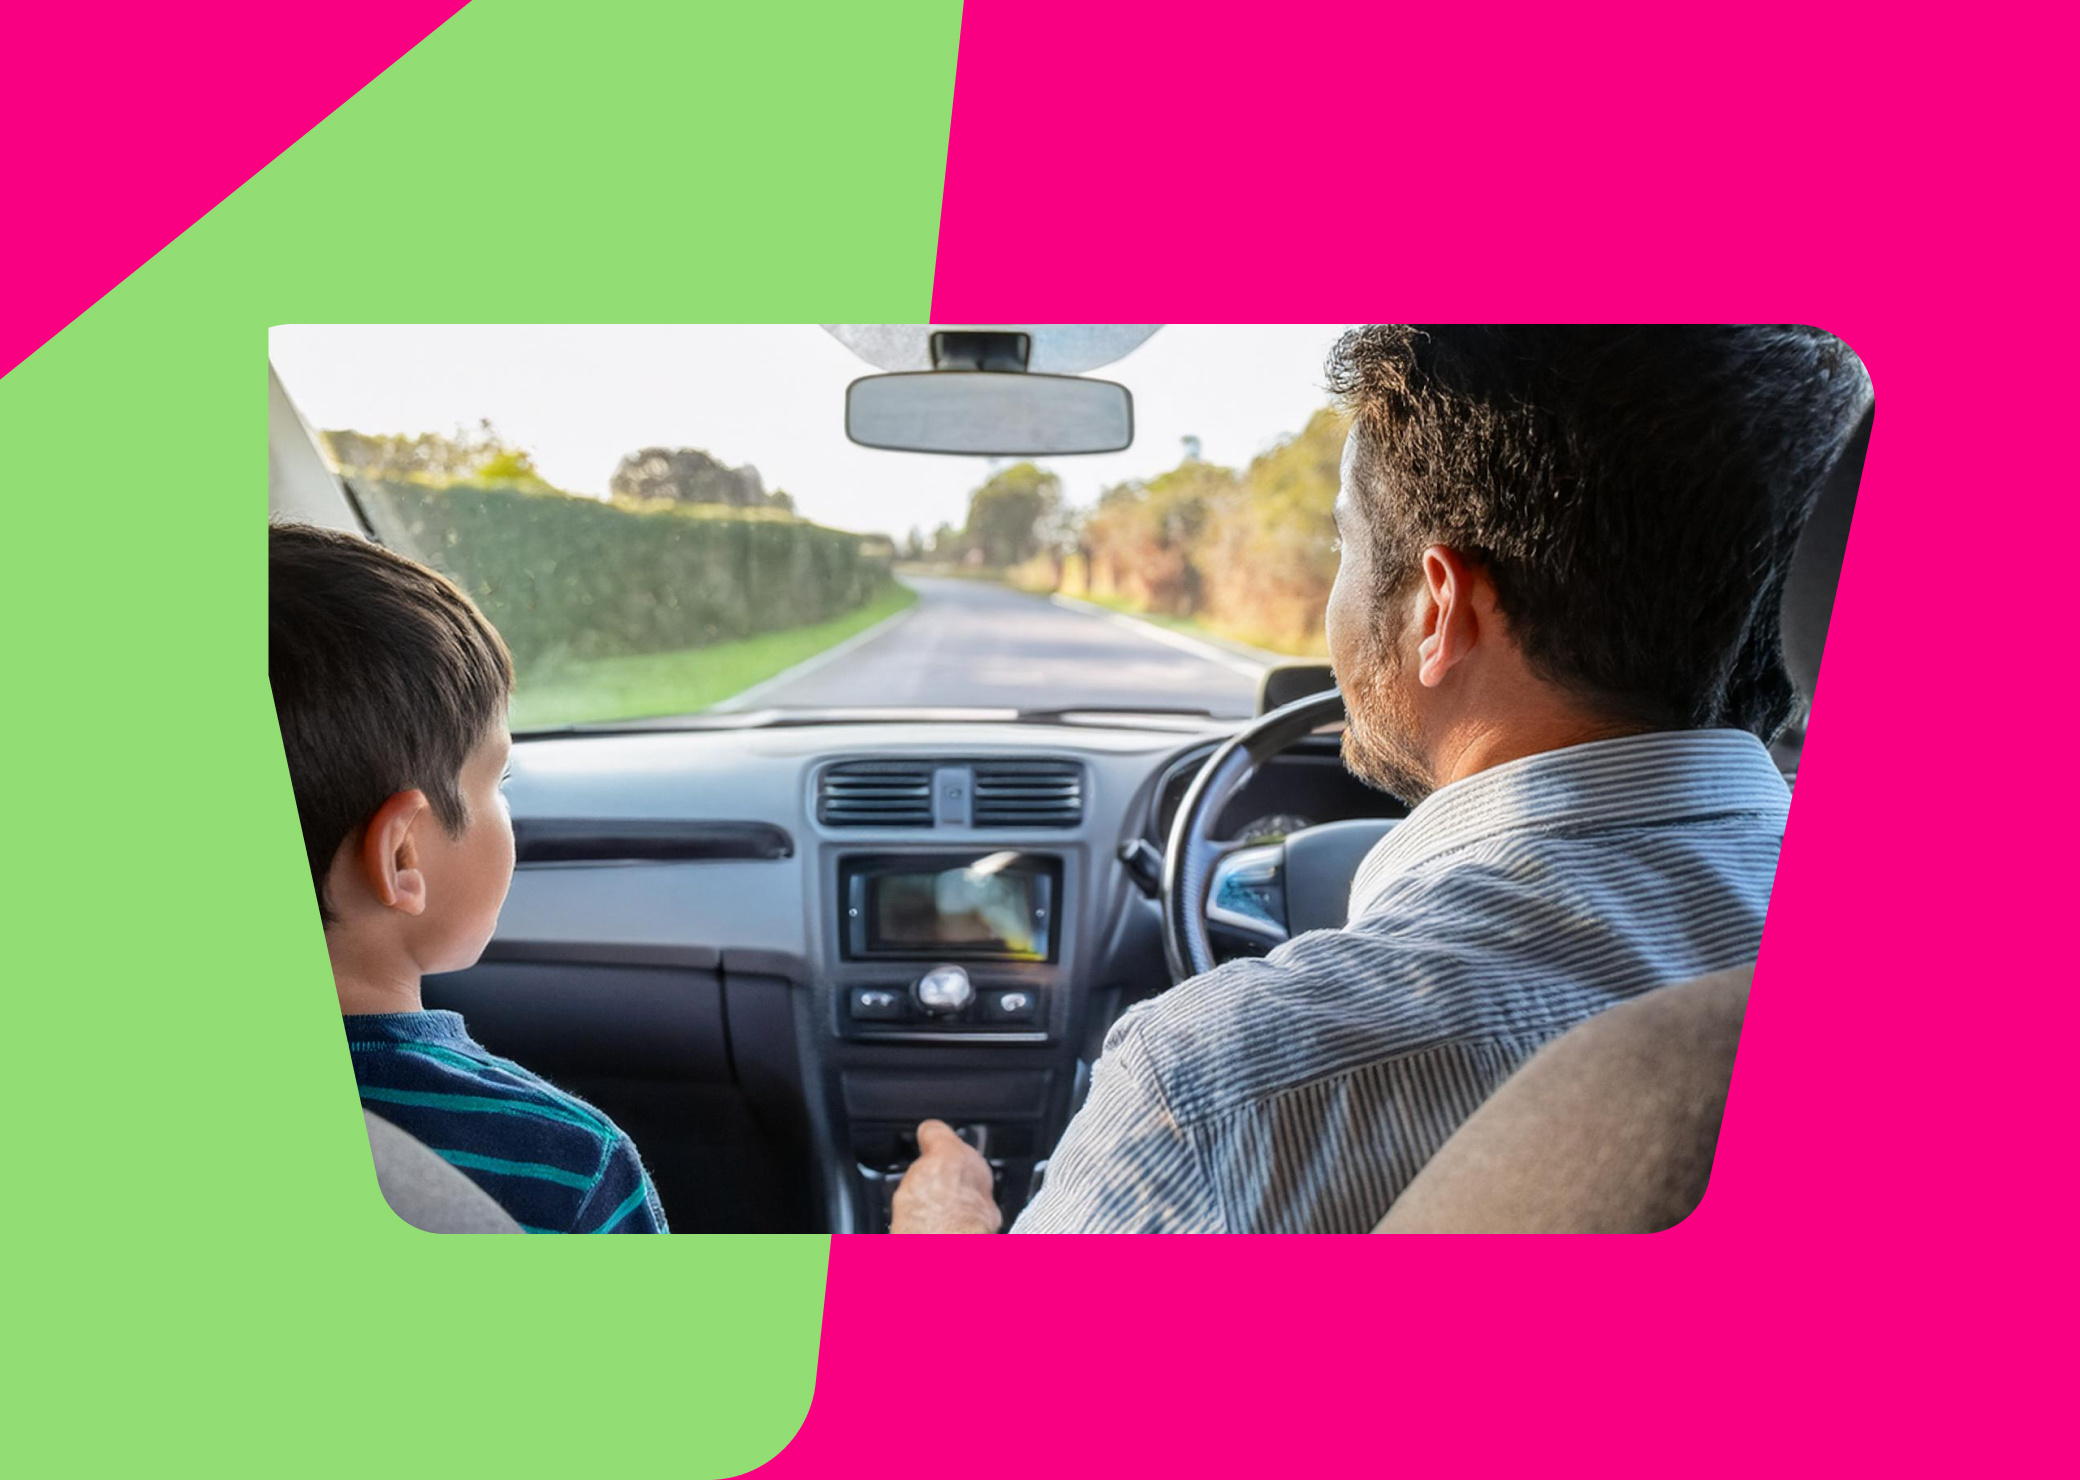
The school run – a daily ritual for millions across the UK – is often seen as a mundane part of the routine. But our latest research suggests it’s anything but dull, with a surprising number of parents admitting to speeding, feeling rushed, and even breaking the law in a bid to get their children to school on time.
So, what’s really going on behind the wheel during these hectic hours?
The Need for Speed – Even on the School Run
Shockingly, more than half (56%) of drivers admit they’ve exceeded the speed limit during the school run – with 15% saying they do so all the time.
Men are significantly more likely to admit to speeding during school drop off and pick up than women, with 60% of men owning up compared to 49% of women. Fathers are more commonly behind the wheel for the school run, with 49% taking on the responsibility versus 23% of mothers. This difference is mirrored in speeding behaviour, as 48% of fathers admitted to breaking the speed limit during school runs, while only 19% of mothers said the same.
Why Are People Speeding?
When asked about their motivations for exceeding the speed limit, here’s what drivers said:
- 40% were simply running late
- 30% didn’t want their child to get into trouble
- 30% felt rushed by the school schedule
- 27% had somewhere else to be afterwards
- 23% were trying to avoid traffic
- And 16% admitted they just “like to drive fast”
For some parents, the pressure to be on time goes beyond punctuality - it’s financial. While the exact number of UK schools that issue fines for lateness is unclear, all schools are required to consider imposing fines if a child misses 10 or more sessions (equivalent to five days) of school for unauthorised reasons within a 10-week period, and this includes persistent lateness.
Around 16% of drivers said that they sped on the school run because they didn’t want to risk receiving a fine from the school for being late. Overall, 5% of respondents said they feel direct pressure to avoid these fines.
Consequences of Speeding
Speeding is extremely dangerous to those outside and inside the car. Travelling too fast for the road conditions contributed to 22% of all road deaths in 2023 while exceeding the speed limit was a factor in 27% of fatal incidents.
Our survey found that over a quarter (26%) of respondents had been caught speeding while taking a child to or from school. This statistic is troubling for safety reasons and also results in serious legal ramifications for those involved. Of those caught speeding:
- 54% were caught up to three times
- 40% received a fixed penalty fine
- 35% had to attend a speed awareness course
- 27% received three points on their license
- 16% were hit with a driving ban or disqualification
- 13% faced a court summons
And despite the frequent infractions, only 8% of people correctly identified that the speed limit outside schools varies by council and signage – many wrongly assumed it's always 20mph or 30mph.
What Types of Cars Are Speeding?
When asked which vehicles are most often seen speeding or driving recklessly near schools, 29% of people pointed to sporty or high-performance models, while 28% cited luxury or premium brands such as BMW, Audi, and Mercedes-Benz. SUVs and 4x4s followed at 23%. Other vehicles mentioned included motorbikes, vans, family cars, and compact models.
Regional Rundown: Which Cities Are the Speediest – and the Safest?
The data paints a clear picture of how driving behaviours during the school run vary across the UK. Belfast ranks as the city with the highest percentage of drivers admitting to speeding (75%), followed closely by Leeds and Norwich (both 67%).
When it comes to being caught, Leeds tops the table, with 46% of drivers having faced consequences for speeding. On the flip side, Newcastle stands out as the safest city, with 71% of drivers claiming they’ve never sped on the school run.
Other cities showing strong road safety habits include Plymouth, Sheffield, and Southampton, highlighting regional differences in how seriously drivers take safety around schools.
Beyond speeding, a range of other concerning behaviours are regularly observed during the school run. While 16% of people notice speeding every day, many also report seeing other unsafe or inconsiderate driving habits. A significant 41% say they frequently see cars parked on pavements, and 37% spot vehicles stopping on double yellow lines or school zig-zags.
A third (35%) of respondents have witnessed drivers using their phones behind the wheel near a school. Other common issues include blocking driveways (36%), stopping in the middle of the road to drop children off (34%), leaving engines idling while parked (28%), and driving aggressively or impatiently (27%). These behaviours not only create congestion but also pose serious risks to children and other pedestrians.
How Drivers Feel About It All
Many drivers from our survey are calling for safer roads around schools, with 43% supporting stricter enforcement of speed limits in these areas. There’s also growing concern about pedestrian safety, as 15% of respondents believe the roads near schools are not safe for those on foot.
These apprehensions are supported by alarming data: in 2022, over 3,400 children aged seven or under were killed or injured on roads in Britain, equating to nine young children harmed every day.
Final Thoughts
While the school run can often seem like a race against the clock, these stats reveal the extent of the problem. Whether it’s brushing up on speed limits, being mindful of driving habits, or simply planning a bit more time into the morning, safer school runs start with all of us.

.webp?width=832&height=592&name=customer-support%20(1).webp)


 Car Finance
 Cars & Gadgets
 Car Maintenance
 Tips & Advice
 News
News
 Road Trips
 Pop Culture
.webp?width=400&height=285&name=online-shoppers-with-dog%20(1).webp)


.jpg?width=500&height=356&name=Vintage%20car%20going%20to%20an%20old%20town-1%20(1).jpg)